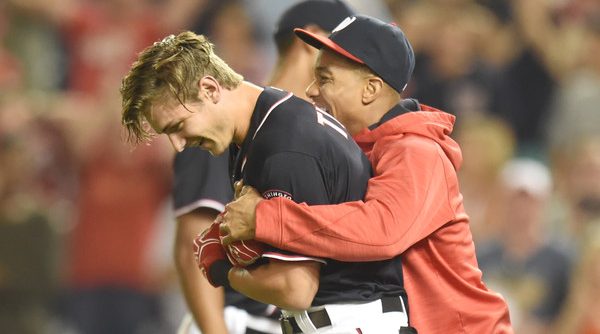
With a playoff berth looking surer by the day, the Washington Nationals must look to October. The franchise’s playoff history is far from sterling, but what about this year’s team? Could they be the ones to break through and bring DC its first baseball title since 1924? One easy way to figure it out is by looking at how the past few champions have made their way to destiny.
2015 World Series Champs – Kansas City Royals
The most recent champs, the Kansas City Royals, steamrolled through the AL Central on their way to the title. After making the World Series in 2014, the Royals defied projection systems to finish 95-67 and spent 143 days in first place. This Royals team, though, was unlike any championship team in baseball history.
The Royals offense was only slightly above average during the regular season. The team as a whole finished with the 11th best wOBA in the bigs and scored the 7th most runs on the season. Those runs were usually manufactured as the Royals had only 139 home runs on the year, ranking them 24th in the league and nearly 100 dingers behind the league-leading Blue Jays. What the team lacked in power they made up with contact ability. The Royals were practically allergic to taking pitches, and it resulted in the lowest walk rate in the league. The contact heavy approach at the plate paid off as the Royals also had the lowest strikeout rate in the league, over two percentage points lower than the next team. Putting the ball in play constantly worked because the Royals were some of the best baserunners in MLB in 2015, from speedy outfielders like Lorenzo Cain to the secretly quick first baseman Eric Hosmer. As a result, the team posted solid numbers against “power pitchers” (defined by Baseball Reference as pitchers in the top third of the league in strikeouts plus walks) in the regular season with a .705 OPS
The pitching staff, though, was less impressive than the offense for the Royals. The 2015 squad has an argument for the worst collection of starting pitchers to ever win a World Series. The starters on the whole were in the bottom third of the league with a 4.34 ERA and nearly last with a 6.49 K/9. The starter with the lowest ERA, as you expect, was the mighty Chris Young with 3.06 followed by retread Edinson Volquez with a 3.55 ERA and no other regular starter with an ERA under 4.00. Even midseason pickup Johnny Cueto posted a lackluster 4.76 ERA during his time in the royal blue. Of course, the Royals were known for their dominant bullpen. The Royals collection of relief arms did post the second lowest bullpen ERA in 2015 at 2.72. But on the whole, the bullpen was not overpowering in the traditional sense, posting a middle of the pack 8.38 K/9. The bullpen and the starters were greatly aided by the Royals astonishingly stingy defense. Pick any stat and the Royals defense was at or leading the pack. By Defensive Runs Saved (DRS) the Royals had the second best defense. By Ultimate Zone Rating (UZR), the Royals were the best defense by a wide margin. By FAngraphs’ all-encompassing DEF stat, the Royals were in a league of their own atop the standings. So while the starters were middling the bullpen not a collection of strikeout arms, the Royals defense helped them keep opposing teams off the scoreboard.
Predicting the Royals to win it all, even after their regular season dominance would have been difficult, though. The team limped into the playoffs with a .393 winning percentage in September. The Royals also struggled in the regular season against the teams they would face in the playoffs. The Astros, the Royals ALDS foe, won the regular season series with the Royals 4-2. The Blue Jays, the ALCS matchup, also handled the Royals in the regular season with a 4-3 record in head-to-head matchups. Despite all that, the Royals still came out on top at the end of the year.
2014 World Series Champs – San Francisco Giants
Where the Royals rolled into the postseason as AL Central champs, the 2014 Giants squeaked in as one of the two Wild Card teams with an 88-74 regular season record. It took a single elimination game against the Pirates for the Giants to even punch their ticket to the NLDS.
Despite some of the big names on the roster, the Giants were middle of the pack by almost any measurement. The team finished with the 14th best wOBA in the league and were almost exactly middle of the league in total runs scored. The team as a whole had an average strikeout rate and were below average in walk rate. The pitching staff didn’t fare much better. The starters had only the 16th best ERA in the league with a 3.74 ERA. The bullpen was solid, their 3.01 ERA was good enough for 5th best in the league. The relievers racked up 18 blown saves during the year, though, nearly tops in the league. Even the defense measured right around average by DRS, UZR and DEF.
In some of those key statistic areas, the Giants again failed to separate themselves from the pack. Their record in September was around .500, so they weren’t a “hot” team heading into the playoffs. In the regular season, they hit .267 with runners in scoring position. Against power pitchers, the type of pithers most likely to be pitching in the playoffs, they were pretty terrible, posting only a .637 OPS versus a .698 OPS versus pitchers classified as average by Baseball Reference and .734 versus finesse pitchers.
Similar to the Royals, the Giants struggled against most of the teams they faced in the playoffs. Against the Pirates, their Wild Card game opponent, the Giants went 2-4 in the regular season series. Of course, against the Nationals the Cardinals were only 2-5 in head to head matchups. The Giants did a little better against their NLCS opponent Cardinals, finishing with a 4-3 regular season record. Their worst head-to-head record came against their eventual World Series opponent, the Royals, as the Giants went winless in their three games against Kansas City. Of course, all that was no match for the combo of Madison Bumgarner and Even Year Magic.
2013 World Series Champs – Boston Red Sox
The Red Sox took a different route to the 2013 championship than either team above. They won the AL East with an impressive 97-65 record that could have been better according to the Pythagorean formula that pegged them as a 100-62 caliber team.
The pitching staff was good but not great. John Lackey (3.52 ERA) and Jon Lester (3.75 ERA) paced the starting pitchers on the way to the 11th best ERA in the big leagues with top 10 strike out and walk rates. Koji Uehara emerged as a dominant closer in 2013, posting a 1.09 ERA with 21 saves over 74 innings. The rest of the bullpen left a lot to be desired, though, as they finished in the bottom third of the league in ERA. The bullpen also blew a whopping 24 games on the way to recording only 33 saves. However, the bullpen did rack up strike outs at the 7th highest rate in the league. The defense didn’t help the pitchers out much as they were 14th best according to DRS and 10th by UZR, but a good ways behind the league leaders in both categories.
Where the 2013 Red Sox really differentiated themselves was their power. They were the only team to score at least 800 runs that year, and were over halfway to 900 with 853 runs scored on the season. The Sox had the highest slugging percentage in all of baseball and the second highest wOBA in the league and hit .278 with runners in scoring position. Power pitchers gave them fits, though, as they managed only a .699 OPS versus the top tier of pitchers. They did much better against average pitchers (.783 OPS) and finesse pitchers (.843 OPS), though.
The Red Sox also came into the playoffs on a tear in September with a .640 winning percentage in the final month of the season. They had handled their ALDS foes, the Rays, in the regular season, going 12-7 against Tampa Bay. They weren’t quite as good against their ALCS foes, the Tigers, playing them to a 3-4 record in the regular season.
Now’s the time in this piece where I am supposed to make generalizations based on what the previous World Series winners have taught us and see how the Nationals stack up in those categories. Except, there are no generalizations to be made. One team limped into the playoffs and relied on a great bullpen and even better defense and team speed to win the World Series. One team barely qualified for the playoffs and lacked a single dominant trait but got carried by a hot starting pitcher. The other was slightly above average in all facets of the game but came into the playoffs on a tear and had the ability to out slug any opponent. Two of the teams had losing records in the regular season against nearly every team they faced in playoffs. Two of the teams struggled against power pitchers, even the one who was historically dominant on offense. So yes, I could pull some numbers on the Nationals to share with you, but none of them will carry any predictive value.
Furthermore, people much smarter than I have spent much longer time than I have analyzing what makes a successful playoff team and have come up empty. There is no “secret sauce” in the makeup of certain teams that destines them for post season success. Record over the last few weeks of the regular season? Statistically meaningless. Even historically great regular season teams have less than a 50% chance of winning the World Series. Take your pick of other stats or narratives, and they have already been debunked. In the end, the playoffs are just hard to predict. It’s not an easy road for any team, but talent gives you a better chance of winning. And the Nationals have been one of the most talented teams in 2016.
Tags: Nationals, Nats, Washington Nationals


Leave a Reply