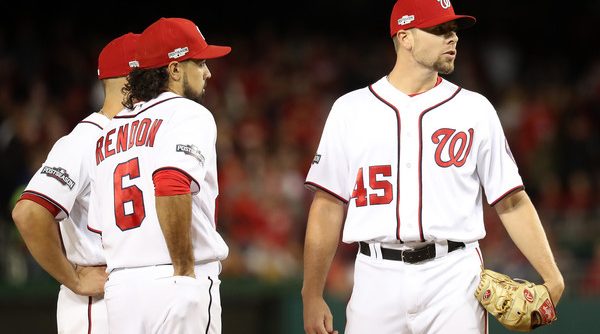
The Nationals announced today that Blake Treinen will start the season as the closer, ending months of speculation that began right as the Nationals were eliminated in the NLDS last October. Their failed runs at the elite free agent closers showed a commitment to shoring up what has been a weak spot in the franchise’s history, but they came up empty.
Of the three reported finalists for the spot — Treinen, Koda Glover, and Shawn Kelley — all had their flaws. Glover is a rookie with a career 5.09 MLB ERA. Kelley has had two Tommy John surgeries and may not pitch back-to-back days. Treinen has had struggles with lefties and command, though he made strides in both areas last year. But the fact that this decision was so close implies something else: These players are not far apart, talent-wise. And because of that, it doesn’t really matter who the closer is.
Let’s look at this from an analytical standpoint. What would the damage be if the Nats chose the worst possible option to close? To figure this out, we need to make some assumptions. First, let’s be charitable and say the true-talent difference between the best and worst option is three-quarters of a run in ERA. For reference, the difference between the highest (Glover) and lowest (Kelley) projected ERAs according to FanGraphs is 0.45 runs. A difference of 0.75 runs means the worst option will allow one run every 12 innings that the best option would not.
I don’t know about you, but one run every 12 innings doesn’t seem like a lot. Over the course of a closer’s season, that comes out to about five or six total runs. Since 10 runs equal one win, that’s a difference of 0.5-0.6 WAR. But since closers pitch in higher leverage situations, WAR does not accurately reflect the number of wins they contribute to a team.
To figure out exactly what those marginal runs would cost a closer, I decided to look at the game logs for Texas Rangers closer Sam Dyson, who is very good but not Britton-level great. Analyzing one player’s appearances is far from scientific, but it can help us get an idea. Dyson only claimed the closer’s job in May of last year, so 17 of his 73 appearances came as a setup man. We will analyze his 56 appearances as the closer: a total of 54 1/3 innings, which means 4.5 marginal runs between our hypothetical Nats closers.
Of those 56 games, 38 were saves. 19 were one-run saves, nine were two runs, and 10 were three runs. Allowing one more run in a tie game turns a win into a tie, so that’s a loss of half a win. We’ll ignore the slim possibility of two or more of these marginal runs happening in the same appearances, so a run allowed in a multi-run save will cost no wins.
Dyson also had 5 blown saves. In three, he left the game tied, so another run would have turned that game into a loss, so those are negative half a win. In the other two, he left trailing, so the marginal run is irrelevant. He pitched in three games where he kept it tied in the ninth, so another run there would lead to a loss and would be negative half a win. 46 saves, blown saves, or keeping games tied late leaves 10 more games. Those 10 were all blowouts, so the marginal run has no bearing on wins or losses.
To simplify the above, allowing one more run would have turned a one-run win into a tie or a tie into a one-run loss in 25 of Dyson’s 56 appearances as the closer. If we assume a marginal run appears randomly, the value of one marginal run for a closer is (-1/2)*(25/56), or -0.223. That means the worst closer option costs the Nats almost a quarter of a win per 12 innings over the best closer, and over a full win over the course of a season.
Of course, this analysis is insanely flawed for a number of reasons. It’s a very small sample of closer outings. Blowing a one-run save or turning a tie game into a one-run deficit does not cost the team half a win at home, because they would still get to bat again. Adding one run in random places is not how having a higher ERA works at all. While it’s far from perfect, this exercise gives us a ballpark idea of what the difference between two closers can mean in terms of wins.
One win is a very meaningful amount, but it’s not the true cost of picking the worse closer. First, the better pitcher would be a setup man, where he would allow one fewer run per 12 innings than the worse pitcher would in that position. Having the worse closer is still damaging because he allows those runs in a higher leverage spot, but having a better setup man defrays that cost in runs significantly. Second, the Nationals could easily identify if they put the worse pitcher in the ninth inning. Even if it’s not measured by runs, the team could see that, say, Glover is looking extremely sharp while Treinen’s command issues have returned and swap their roles. If that could be done within a small number of innings, the cost of making the wrong choice now is basically nothing.
One drawback to putting Treinen in the ninth is limiting his utility as a fireman who can come in and induce a ground ball to get a double play. He can still do that in the eighth, perhaps getting five- or six-out saves, but if that situation arrives in the seventh or earlier, the phone will ring for another pitcher who is much less adept at getting ground outs.
At the end of the day, who the Nationals choose to close will not be as consequential as it seems now. Even if the chosen closer tanks, the difference in wins will be very small because he can be replaced quickly. A closer is surely most important in October, but unless one of these guys really stands out, Mike Rizzo might just swing for a veteran closer in July.
Tags: Blake Treinen, Koda Glover, Nationals, Nats, Shawn Kelley, Washington Nationals


Leave a Reply