There was some big news in the world of baseball nerds this week. While you were probably distracted by this series in Colorado, with scores looking more like football games than baseball games, MLB released a whole bunch of fun new Statcast based tools via Baseball Savant. Statcast, as you have likely heard by now, is the new radar based tracking system installed in every MLB stadium.
This system tracks all the movements on the baseball field, from positioning of defenders to launch angle of batted balls to the rotation of a thrown ball. If you have heard terms like “catch probability” or “exit velocity,” you have Statcast to thank. It’s a new system that has lots of potential to teach us new and exciting things about the game. For now, though, it’s mostly a cool new tool to play with. With that in mind, what do these new tools have to tell us about the Nationals?
Outfield Depth
Defense is the new frontier in baseball analytics. It’s a tough nut to crack, given the number of variables at play, but Statcast is slowly helping us assign values to some of those variables. The new data point we have to work with is outfield depth: how far an outfielder lines up from home plate before each pitch. In the long run, this may help us judge an outfielder’s defensive ability as we will be able to measure how far and how fast the defender went to catch a ball. For now, though, the data shows us that the Nationals are playing one of the shallowest defenses in all of baseball. Carlos Gomez is playing the deepest center field in all of baseball at an average of 331 feet, and Billy Hamilton is playing the shallowest at 298 feet, and Adam Eaton isn’t much deeper at 309 feet.
It’s hard to determine anything from one data point. It’s entirely possible that Eaton lines up so shallow because he is more comfortable going back on the ball than most defenders, just as it’s possible that the Nationals’ coaching staff has positioned him there. Taking a look at where Bryce Harper and Jayson Werth line up, however, makes it pretty clear that the Nationals’ approach this season is to play a shallow outfield defense. Only four right fielders play shallower than Harper’s 308 feet. Even the not-so-fleet of foot Werth is playing shallow at 309 feet, shallower than only five other regular left fielders. One data point could be an outlier, but seeing all three Nats defenders lining up so shallow clearly indicates this is a team wide approach. It would be interesting to ask why the Nats have taken this approach. For now, we will have to see if this strategy pays off.
Outfield Depth, Part II
So we have discovered that the Nationals outfield defense is playing shallow, but how are opposing teams lining up their outfielders against the Nats? Now we have an answer, and it might not be exactly what you would expect.
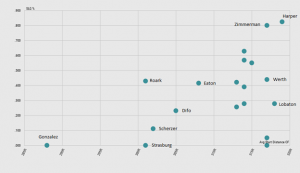
Poor Gio Gonzalez gets no respect. Meanwhile, defenses clearly respect Harper’s power, as opposing center fielders play deepest when he is up at bat. The player facing the second deepest outfield, as you would expect, is Jose Lobaton. Now, context is important here. This data point is likely skewed by his recent start in Colorado, where the thin air and huge outfield means all defenders play deeper than normal. Moving down the list, it’s clear defenses still respect the pop of Werth and the resurgent Ryan Zimmerman. On the other end of the spectrum, teams clearly aren’t worried about Wilmer Difo or Eaton hitting the ball out of the ball park much — at their own peril.
Launch Angle
Launch angle, the direction the ball takes after a batter makes contact, isn’t a brand new concept. Daniel Murphy used the concept to help him make the famous changes to his swing, a concept he passed along to Zimmerman in the offseason. What is new is the detail and graphics now available to demonstrate launch angle. And there is no better example of the importance of launch angle than the previously mentioned Zimmerman. In 2016, he was an exit velocity champ, generating some of the hardest-hit balls in all of baseball. Of course, all those hard hit balls didn’t do much good because he had a terrible launch angle. A picture is worth a thousand words, so I’ve heard, so check out the graphic below of all balls Zimmerman hit at 100 MPH or harder in 2016:
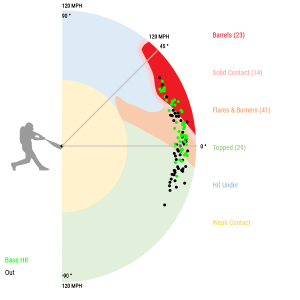
Only 35% of Zimmerman’s hard hit balls in 2016 were close to being at an ideal launch angle; the rest were hit mostly on the ground. Compare that to the same chart for Zimmerman from 2017:
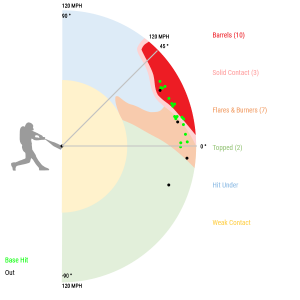
In 2017, just shy of 60% of the balls Zimmerman has smacked at 100 MPH or greater have been at the ideal launch angles. Even more important, only three balls have been hit below zero degrees in 2017 versus all those batted balls below the zero degree line in 2016. So while we had reason to suspect earlier that Zimmerman’s offensive outburst was for real, now we have the evidence to prove it.
Play Charts
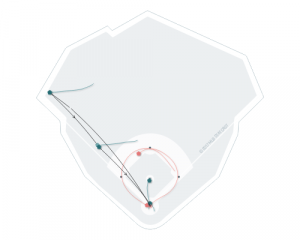
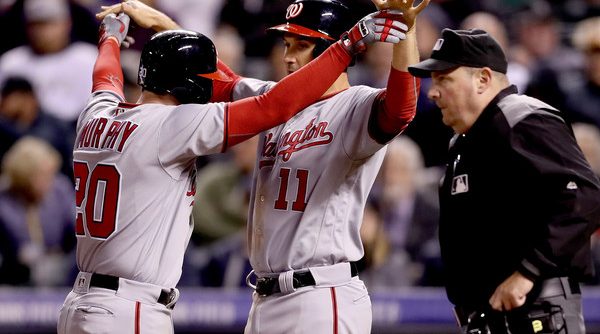
If all the nerd talk tired you out, this one is for you! Since Statcast tracks all movements on the diamond, they can generate play charts of all the important movements on any play. What kind of deeper insight into the nature of baseball does this offer? No idea! But they still look pretty cool. Let’s wrap on the chart of Murphy’s walk off double against the Phillies; the same walk off that resulted in the greatest on field hug in Nationals’ history:




Really good stuff. Love the effective use of advanced stats. Great to see Zim’s hot start is backed up by the launch angle gods.