The Washington Nationals are doing impressive things in the first half of the 2017 season. The offense has been particularly dynamic, with standout performances from Bryce Harper, Ryan Zimmerman, Daniel Murphy, and Anthony Rendon placing the Nationals in the top five in multiple offensive categories such as wRC+ (4th), wOBA (2nd), average (2nd), on base percentage (2nd), runs (2nd) and stolen bases (5th).
The starting rotation has been similarly successful, landing in the top five in baseball in ERA (3rd), innings pitched (1st), K/9 (2nd), HR/9 (3rd), and WAR (3rd). Max Scherzer has jumped out to maybe the best start of his career, Stephen Strasburg has been solid while making the All Star team, and Gio Gonzalez has led a career reviving campaign while being in the top 10 in baseball in starter ERA.
Add to that the 9.5 game lead the Nationals enjoy in the N.L. East, the largest division lead in the National League, and by this third paragraph on this piece you’re wondering what there is to be concerned with in the 2017 campaign.
…and then you find the bullpen. A list of categories that the Nationals would be in the bottom five in baseball would be… well… pretty much all of them. To narrow it down a bit, let’s list a few that they are the absolute worst, awfullest, crappiest, and downright most shameful in all of baseball. First you have to start with their ERA (5.20), and then you can progress to their HR/9 (1.64), HR/FB (15.8%), and you can wrap up the parade of not-even-close-to-good with their WAR. It comes in at “what did he just type?” -0.9. Essentially, FanGraphs thinks the Nationals should have been able to find any seven guys sitting around waiting to throw baseballs and they should be better than what the Nats have rolled out in relief in 2017. The Astros bullpen has been almost six full wins better than the Nationals in the first half of the season. Six wins better. In half a season. By the bullpen.
Since it seems clear that barring an epic collapse by the Nats and a strong surge from another N.L. East team that the boys from D.C. will be in the playoffs, it seemed relevant to figure out just how bad this Nationals bullpen has been compared to other recent playoff teams. Looking back at the last five seasons, which is the period of time the Nationals have been a playoff team in their time in D.C., the results were quite startling. Fifty different squads have assaulted October since 2012, including the Nationals three times, there have been decently disparate results. If you look at the graph below you can see ERAs that range for an absurdly stingy 2.18 from the 2015 Kansas City Royals squad to the sky high 5.10 from the 2016 Texas Rangers.
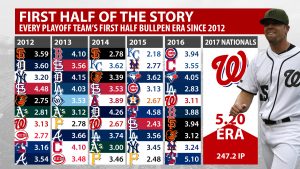
That Rangers squad is a bit of an outlier amongst this group though. They are the only squad with an ERA over five, with the next highest being the soul crushing (to Nationals fans) 2012 Cardinals at 4.48, and the 2015 Rangers at 4.38. Less than 20% of playoff bullpens had a first half ERA over 4.00. The Nationals currently sit at 5.20.
Not only would this be the highest of any playoff bound team in the last five years, but it would be the second highest first half bullpen ERA period in that span, only limping in behind the laughable 2016 Reds bullpen which gave up runs at a helium filled ballon like number of 5.73.
So what is driving this weakest of links for the Nats? The most glaring thing that jumps out is they are giving up home runs with startling frequency. The ‘pen have offered up bombs at a worst in baseball 1.64 HR/9, and their HR/FB rate is also a worst of the worst 15.8% in the first half. In simpler terms, about one out of every six fly balls hit off a reliever for Washington manages to leave the yard.
If that sounds bad, it is. The Nationals have been so bad in relief that the manager Dusty Baker essentially has found them unusable. So much so that they have pitched the fewest relief innings in baseball at 247.2. To give some context Nationals fans would be familiar with, if you looked at their last three playoff bullpens and compared them to this years, the difference is dramatic. Taking these three stats trying to diagnose the calamity that is the bullpen (ERA, HR/FB %, Innings Pitched) you can see the previous three playoff bullpens were much better:
2012: 3.13 ERA, 258.2 IP, 7.5% HR/FB (2nd best in MLB)
2014: 2.67 ERA, 280 IP, 4.9% HR/FB (1st best in MLB)
2016: 3.11 ERA, 252 IP, 9.5% HR/FB (2nd best in MLB)
2017: 5.20 ERA, 247.2 IP, 15.8% HR/FB (30th best in MLB).
Well then. So it seems obvious that the Nationals, if they want to be true World Series contenders, must improve. The absolute worst first half bullpen ERA in the last five years of any team to reach the World Series was the 2013 Boston Red Sox who came in at 4.10, well below the current Nationals. A ray of hope might be in the fact that the 2016 Rangers pen who were almost the Nationals equal in futility managed to bring in a 2nd half ERA that was almost a run lower than their first half, but that was still higher than the 2013 Red Sox.
Unless they can beat recent historical precedence, the Nationals are going to have to dramatically overhaul their bullpen out put if they want a shot at living up to the potential of the rotation and juggernaut lineup in October.
Tags: Nationals, Nats, Washington Nationals


Leave a Reply