Over it.
That’s clearly how Ryan Zimmerman felt about launch angle discussion back in mid-May. He made jokes, he made snarky comments, and after a while he just didn’t want to talk about it anymore. He kept saying over and over it wasn’t about the change in his launch angle, it was that he was finally healthy again. It was his health that had Zimmerman having a career year and a career resurgence with whispers that Comeback Player of the Year was his floor, and maybe MVP was his ceiling.
And if you took stock of the situation in early to mid May that might be how Zimmerman framed the amazing start in his mind. It was not, however, what this writer believed to be the thing that had Zimmerman hotter than a D.C. sidewalk in July (Spoiler: Launch Angle).
Then it all fell apart again.
If you look at a rolling 15-day wRC+ for Zimmerman this season, he peaked at an absurd 296 on May 6th. In layman’s terms, he was three times better than the average major leaguer for the 15 games leading up to the Nationals’ 29th game of the season. Ever since that point, he has started to precipitously slide back into the form that wrecked his 2016 season.
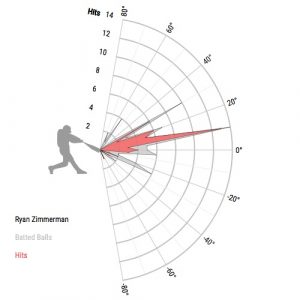
Don’t believe me? Of course you do, but maybe you’re more of a visual learner. So next take a peak at these launch angle charts provided by Baseball Savant. Here is Zimmerman up to that May 6th game:

Now that is a thing of beauty. Draw your attention to not just the pink area showing his hits and how they are almost exclusively above the zero degree mark, but also look at how few outs he is making on balls hit down. Keeping the ball in the air made Zimmerman an incredibly effective hitter.
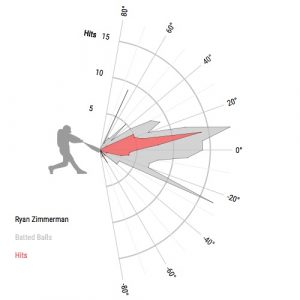
Now let’s look at all his batted balls after May 6th:

First take a look at the pink section. Ryan is still getting his hits on balls he hits in the air. He is also not as lucky as he was on all of those balls he hit in the air. But more important look at that giant stabbing spike around negative twenty five degrees. Those are all those pesky ground balls Zimmerman wasn’t hitting early in the year.
Maybe you’re not a visual learner. How about this then: Up until May 6th Zimmerman had a GB/FB rate of 0.97, meaning he was hitting more fly balls than ground balls. After May 6th, his grounders have skyrocketed to the tune of a GB/FB rate of 1.61. His wRC+ has tumbled from a daunting 249 to lead off the season to a disappointing 82 since then. That means, since May 6th, Zimmerman has been 18% worse than an average major leaguer.
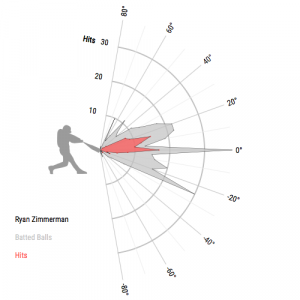
Most disturbing of all might be this final visual, which is Zimmerman’s launch angle chart from his disastrous 2016 season:

That’s ugly, but what’s really scary is how much that giant spike at negative twenty five degrees resembles the current downslope Zimmerman has been on. There is nothing of late to indicate that Zimmerman has been ailing physically, so maybe, just maybe, he should start hoping people start bugging him about his launch angle again.
Tags: Nationals, Nats, Ryan Zimmerman, Washington Nationals


Leave a Reply